The Programme Problem
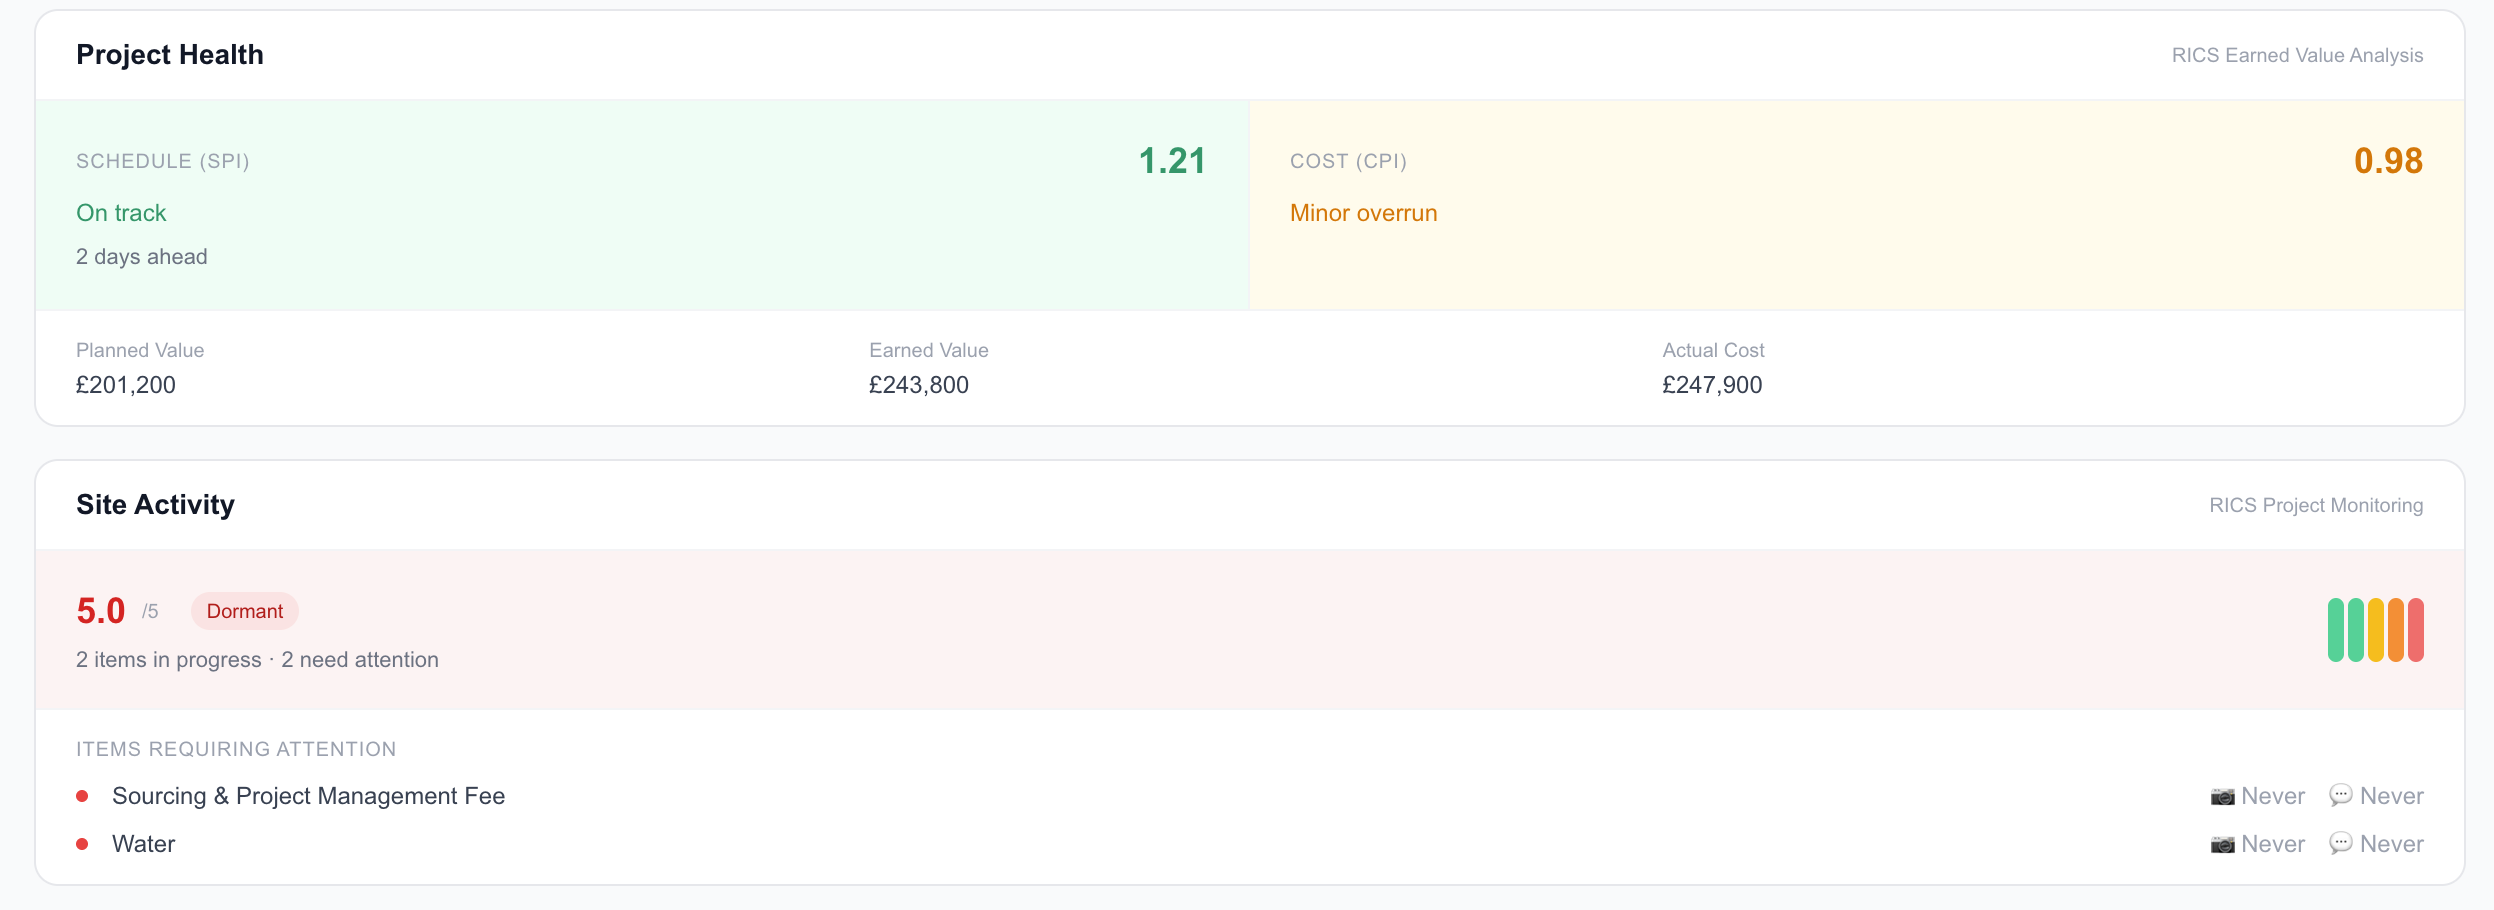
Schedule Performance Index (SPI) and Cost Performance Index (CPI) are earned value metrics. SPI below 1.0 means the project is behind programme. CPI below 1.0 means the project is over cost. Together they give an objective picture of how a development is performing against its baseline plan.
Why SPI and CPI matter and why the timing is wrong
Schedule Performance Index (SPI) and Cost Performance Index (CPI) are earned value metrics. SPI below 1.0 means the project is behind programme. CPI below 1.0 means the project is over cost. Together they give an objective picture of how a development is performing against its baseline plan.
Most development lenders use them. The QS calculates SPI and CPI at each site visit and includes them in the monitoring report. The lender reviews the report, checks the numbers, and flags anything below their threshold.
The problem is the cadence. QS visits happen every 60 to 90 days. SPI and CPI at the last visit might be 0.95 and 0.98 respectively: within tolerance, no action required. But in the 60 days since that visit, SPI may have dropped to 0.82. The groundworks contractor had a key subcontractor go under. Structural steel delivery is running four weeks late. The critical path has shifted. The facility's long-stop is now at risk.
The credit officer won't know until the next QS visit. By then, the slippage is established. The question is no longer how to prevent it. The question is what to do about it.
Early programme slippage is recoverable. A contractor running 8 days late at week six can be brought back on track with additional resource, a revised programme, or a subcontractor change. The same slippage discovered at week fourteen, after it has cascaded to the following stage, is much harder to recover from. The difference between those two outcomes is how quickly the lender knows.
What causes SPI to move between QS visits
The QS measures what has been completed at the point of visit. Between visits, progress continues (or doesn't). Three categories of event move SPI without the lender seeing it:
1. Work item completions and failures
Individual work items are completed, approved, and signed off continuously as the build progresses. A concrete pour completing on schedule improves SPI. A steel delivery arriving two weeks late and holding up the frame drops it. These events happen between QS visits, and SPI moves with them, but no one is aggregating that movement until the next site visit.
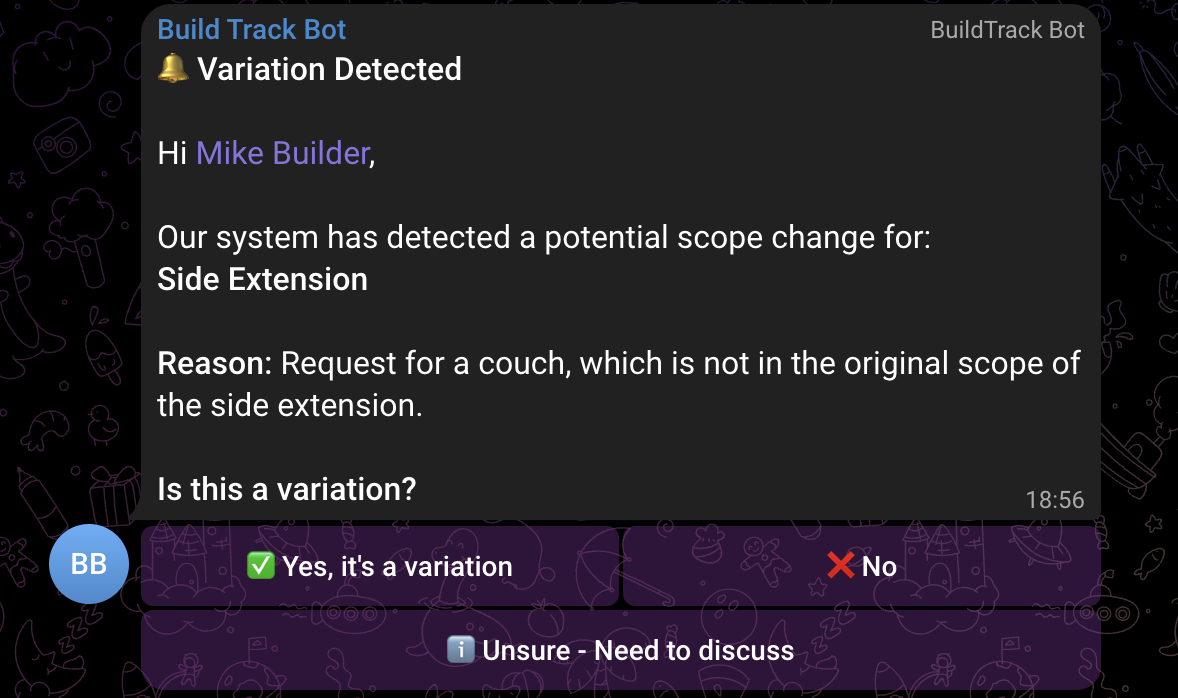
2. Undisclosed variations
A developer requests a design change mid-build. The contractor agrees and issues a variation order. The original programme is now void for that section of work. The new programme may add two weeks. The developer doesn't tell the lender because the JCT contract handles it between developer and contractor directly. The lender's programme baseline is now wrong, and SPI calculated against the original baseline is misleading.
3. Weather and external disruption
Groundworks, foundations, and external envelope work are weather-sensitive. A wet October that pushes back external works by three weeks doesn't appear in any report until the QS visits. The lender knows the weather was bad. They don't know how badly it affected programme until they're told, which is 60 days after it happened.
What continuous site monitoring actually tracks
Continuous programme monitoring is not a QS on site every week. It is a data model of the programme that updates as information arrives between visits.
Work item sign-offs
As individual work items are completed and verified, they update the programme baseline. SPI is recalculated with each new sign-off, not just at the QS visit. A lender can see, on any given day, what percentage of the programme is complete versus what should be complete by that date according to the original schedule.
Variation capture
Variations to the JCT scope are captured as they are issued, either from formal variation orders or from communication between the developer and contractor. When a variation is logged, the programme is updated to reflect the revised scope. The lender's SPI calculation is always against the current programme, not an outdated baseline.
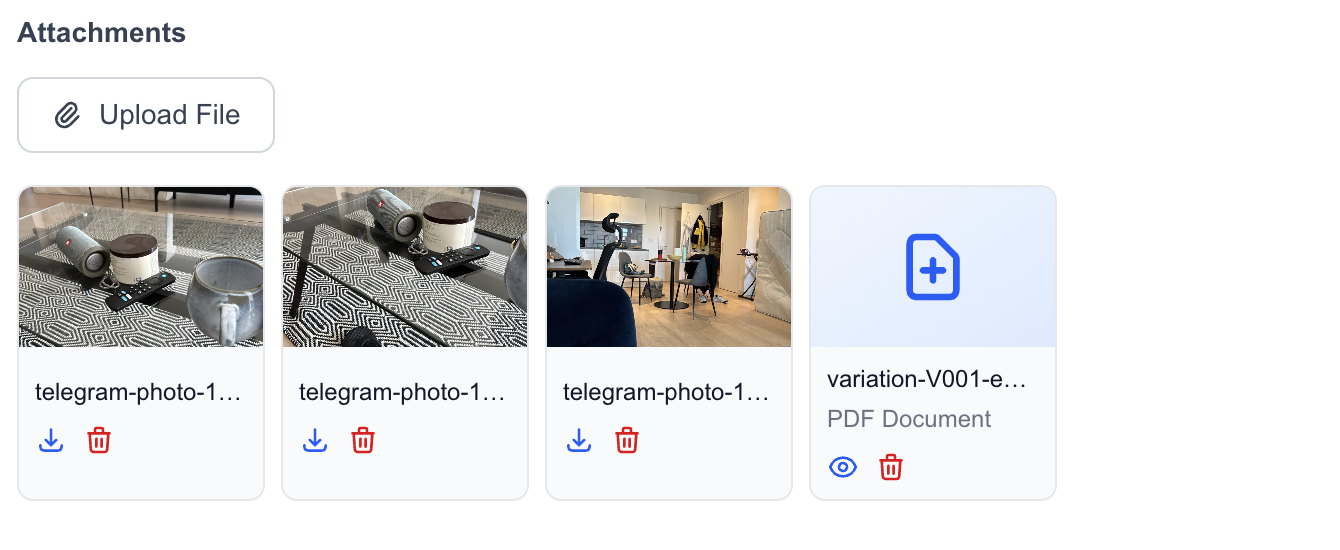
Geotagged site photos
Photos taken on site, tagged to specific work items and dates, provide visual confirmation of progress between formal QS visits. A photo of completed groundworks, tagged to the groundworks work item, updates the programme model without requiring a full QS visit for that item.
SPI and CPI together: the early warning signal
SPI and CPI individually describe two different problems. Together, at the same time, they describe a contractor's overall position on the project.
| SPI | CPI | What it tells you |
|---|---|---|
| Above 1.0 | Above 1.0 | Project is ahead of programme and under budget. Monitor normally. |
| Below 1.0 | Above 1.0 | Behind programme but under budget. Contractor is slow but not overspending. Check whether the slippage is recoverable or structural. |
| Above 1.0 | Below 1.0 | Ahead of programme but over budget. Work is happening fast but costs are running ahead of plan. Check the cost plan and contingency position. |
| Below 1.0 | Below 1.0 | Behind programme and over budget simultaneously. This is a distress signal. The contractor is delivering less work and spending more to do it. Immediate review required. |
That bottom row, SPI and CPI both below 1.0, is the condition that precedes most construction loan distress situations. It rarely arrives suddenly. It develops over two or three stages, with each stage being individually within tolerance, while the combined trend is clearly deteriorating. Continuous monitoring catches the trend before it becomes a crisis.
What this doesn't replace
Continuous programme monitoring is not a substitute for QS site visits. The QS validates physical progress, quality of work, and the structural integrity of completed stages. That requires a person on site. It cannot be automated.
What continuous monitoring changes is the gap between visits. The QS arrives at a site where the lender already knows the programme position from the last 60 days of work item updates, variation logs, and site photos. The QS visit becomes a validation of what the lender already knows, not a discovery exercise.
That changes the nature of the QS report. Instead of "here is what has happened since last time," it becomes "here is our confirmation of what you've been monitoring." The lender's position is stronger, the report is more useful, and the cost of surprise is lower.
Summary
- SPI and CPI are the right metrics for ADC monitoring. The problem is cadence: they arrive every 60-90 days, by which point slippage has already compounded.
- Three categories of event move SPI between QS visits without the lender seeing it: work item completions and failures, undisclosed variations, and weather disruption.
- Continuous site monitoring tracks work item sign-offs, variation capture, and geotagged site photos between formal visits. SPI and CPI update as events occur, not as they are reported.
- SPI and CPI together tell a more complete story than either alone. Both below 1.0 simultaneously is the early warning signal for construction loan distress, and it develops gradually. Continuous monitoring catches the trend, not just the crisis.
- Continuous programme monitoring does not replace QS visits. It changes what those visits find: confirmation rather than discovery.
Monitor SPI and CPI between QS visits
Mintstone updates programme and cost performance continuously from work item sign-offs, variation logs, and site photos. The QS visit confirms what you already know.
See how it works →